http://www.eh.net/
And so while I normally just cite the website or source of my data, this web site is actually cool enough that it warrants being referenced.
However, my original intention of going to this site was to look up another curiosity of mine and that is how the primary and best measure of standards of living has fared over the course of time; Real GDP Per Capita.
Of course communist weaklings, incapable of living and supporting themselves in the real world will advance their ulterior motive and call RGDP per capita a flawed measure of standards of living and will instead insist on using crap measures such as "the Human Development Index."
But they are public sector and non-profit wimps, and therefore rather than using their HDI which has been with us a whole whopping 5 or 10 years, we will use the adult measure of RGDP per Capita which has been with us (in one way or another) since the beginning of the country;
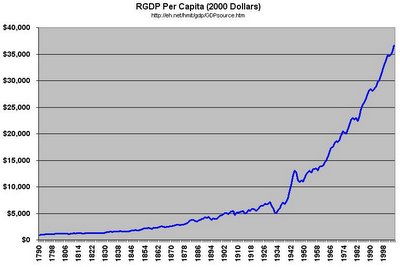
The chart itself is very interesting, note the dramatic drop and then recovery in the Great Depression and WWII. But what I was more curious about was whether we as a country have been improving our standards of living at a faster or slower rate compared to other generations. Thus I calculated the annual change in RGDP per Capita since the beginning of the country;
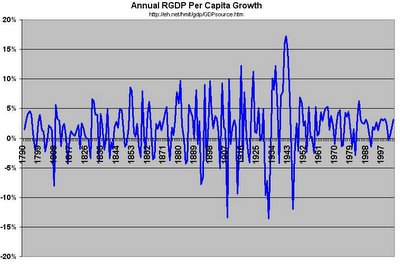
Of course, the length of the data and inherent volatility of economics allows for no discernable trend, so I did a rolling 20 year average.
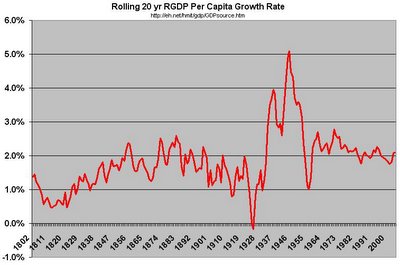
This is where it gets interesting. Notice that for most of the country's existence RGDP per capita grew at about 1.5% or so on the average. Then the Great Depression hit, naturally bringing down standards of living. A rapid increase in RGDP per capita occured when we recovered from the Great Depression. This extremely high growth rate was due to the fact we were coming from such a lowered standard of living that growth rates mathematically were high and the economic boom that WWII brought about. What gets particularly interesting is when RGDP per capita just tanks in the 1950's.
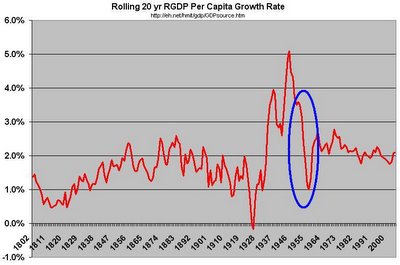
This at first didn't make any sense to me. The 1950's were booming. Economic growth had not been rivalled like that ever in the history of the US. Why were standards of living dropping?
The answer can be found by looking at the "Pre-Great Depression" average growth rate in RGDP per capita and the "Post- WWII" average growth rate in RGDP per capita.

Note that after WWII the standards of living had been increasing at a consistent rate higher than ever before. Traditionally US RGDP per capita grew at about 1.5% per year on the average. After WWII the average was 2%, a full half a percentage point higher.
Savvy liberals and socialists desperate for data that "proves" their economic system works will immediately point out that before WWII and the Great Depression taxes were a mere fraction of what they are today. That after we implemented welfare, social security, and the bevy of other socialist programs standards of living increased at a faster rate, ergo, socialism rules.
Silly socialists.
For you see, there is a different variable that is at play here. And when I say "variable" I should really say "virus" or "sickness" or "epidemic." A plague that has thwarted mankind's attempt to increase their standards of living. A curse that explains the precipitous and contradictory drop in the RGDP per capita growth rate despite a booming economy in the 50's and explains why standards of living are growing faster than they ever have before in the history of the US;
Children.
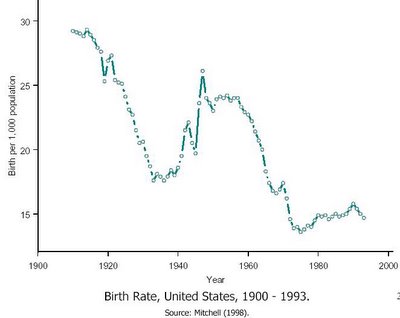 Yes, children. The agricultural economic equivalent to locust. The more children you have, the more capita you have to divide that RGDP by. It should not be a shock that Ethiopia, Somalia and other sh!tholes in the world that have incomes per capita of $500 per year coincidentally have fertility rates of 6-7 children per woman. It should also not shock you that when the Baby Boom took place, standards of living tanked.
The reverse holds true as well as evidenced by the historically low birth rates in the 1970's to today. The less kids you have, the more RGDP you get to keep for yourself (or for you Jensenite I-bankers out there, the more shares of stock you issue, the more diluted your earnings become). Of course, this sadly points out something we already know; we don't owe our higher standards of living to working harder or smarter or advances in technology. And we certainly don't owe it to the volumes of sociology majors and communcations majors we're producing. We owe it because we're smart enough to make sure the denominator in RGDP per capita stays low.
Spot on and enlightening, time after time. I can't discuss your graphs without sounding like a groupie or something. But thank you for showing them.
ReplyDeleteAll I ask is that you show them to the world and educate those little urchins of yours.
ReplyDeleteWow, this was a good one. Concise and clear.
ReplyDeleteOnce I get past my Econometrics class maybe we can collaborate on a paper or something?