So I found it interesting when I was cleaning out the house in preparation to move out of the crap hole that is known as the "city" and into those boring, yet low crime and low tax suburbs a couple articles from The Economist I had set aside.
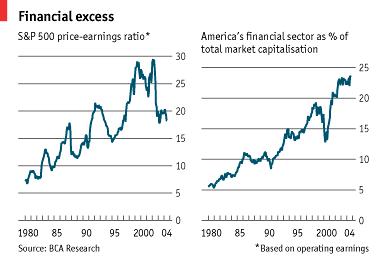
Dated by about 2-3 years, the charts are phenomenal and support my theory that US stock prices are being driven more by retirement cash flows than corporate profits;

Also of concern is the larger and larger percentage the financial sector accounts for in market capitalization, increasing 5 fold since 1980.

But fear not. I'm sure, just like Dotcoms....and Tulip Bulbs...and Beanie Babies...and the South Seas Company...and Indonesia...and the Housing Bubble we're in now, I'm sure, I'M ABSOLUTELY SURE THIS TIME I'M WRONG!
China never looked so good.
Tulip Bulb Mania
ReplyDeleteHolland
About 1550-1600.
outside the current housing bubble, probably the biggest bubble in history.
Search it on the internet.
You back from Denver yet babe?
Heck I miss your "tulips" and I ain't even seen them yet ;P
ReplyDeleteYeah, get out of the city, its burbs time as far as I'm concerned.
The liberals can wallow in their own filth.
The suburbs? Captain... I am disgusted.
ReplyDeleteCaptain, where are you investing your untold riches? I'd think it would be important to look at the fundamentals of the stock market right now. Corporate balance sheets are much healthier than they used to be, and the S&P 500 PE ratio is currently approaching 15, well within historical norms.
ReplyDeletePlus, you're buying a share of a company who's earnings will most likely be increasing if the economy continues to expand so you can probably expect the earnings to continue to increase.
Also, your graph is a little misleading in that it starts in 1980, a terrible time for the stock market and practically a historical low for the PE ratio.
Hi Enrique,
ReplyDeleteGood points, you are right in that corporations are doing historically VERY well. Corporate profits as a percent of GDP are higher than they've been (I think) in 15 years, but inveitably I think the US markets are going to take a little hit in that the majority of their revenue comes from the US. REgardless of how good the management of a firm is, profits come from the wealth producing ability of the nation.
Now, that being said, there are some good US corporations that have significant operations overseas and derive considerable profits from outside the US, so that might be a natural diversifying mechanism in itself, but good ol' GM and Ford (on top of their labor problems) are going to be in for a rough time.
As for why i started it in the 1980's, these aren't my charts, they're from The Economist. I do have charts though at another post titled "When you Abandon Fundamental Value."
Google that, and I think you'll find some mroe longitudinal charts.