I know of one project in a small Minnesota town where the population is 2,200 people, and the developer wants to put in 115 MULTI-FAMILY UNITS!!!
Just assuming 2 dwellings per unit, that means this guy actually thinks the population is going to grow by 25% in 3 years...and that they're all going to want crappy, cookie cutting side to side town homes.
Of course, no study was done to see if demand would actually meet or exceed supply, and home builders just keep on building assuming it will always sell.
Well, aside from high interest rates there's another factor affect/driving housing prices lower; a glut o' supply.
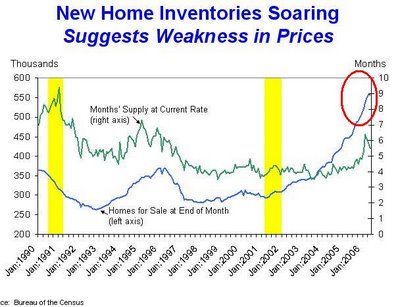
We have record levels of inventory of housing/houses for sale;

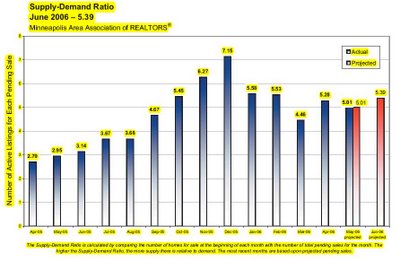
And this was an interesting little chart I found, you can read the description below;

Now, if my economic spidey senses are correct, they tell me that when supply overly exceeds demand something happens to prices. Unforutnately I went to the public schools, so this is a difficult one for me, but I'm guessing, I don't know, maybe they're ummmm going down????
Interesting. What is a "normal market" considered? i.e. chart 2, what would a 'balanced market' be? How many "Active Listings" for each "Pending Sale" is considered a balanced market or healthy market?
ReplyDeleteWe came off an all time historical record real estate boom... are we now at a "normal market"?
According to Chart 1 it appears we entered into excess supply of homes (aka. Bubble Burst) back in the tail end of 2003/ early 2004... (assuming I am reading that chart correctly..)
ReplyDeleteYet 2005 was a record year for appreciation and real estate sales.
I am told by my realtor that the number that is considered "normal" is 5. He wanted me to know that it was 5. He made it quite clear it was 5.
ReplyDeleteI am only reiterating that it is 5 in fear my realtor will send me another e-mail unless I make it perfectly clear, it is 5.