So what I did was went to EH.net and downloaded RGDP for the US going back to 1790 and calculated the 5, 10 and 20 year variances in RGDP growth rates, resulting in a chart that I left at my other office. Of course, it doesn't matter too much because official GDP data was not consistently compiled before the 1930's, so the estimates are somewhat questionable. Regardless, the chart did confirm what I saw, the volatility in economic growth has been decreasing.
I wanted to use some more consistent data and so I went to the FRED database at the St. Louis Fed and ran the same calculations except since 1947 we've been recording RGDP quarterly, allowing for more datapoints. This resulted in 5, 10 and 20 QUARTER variances shown below;
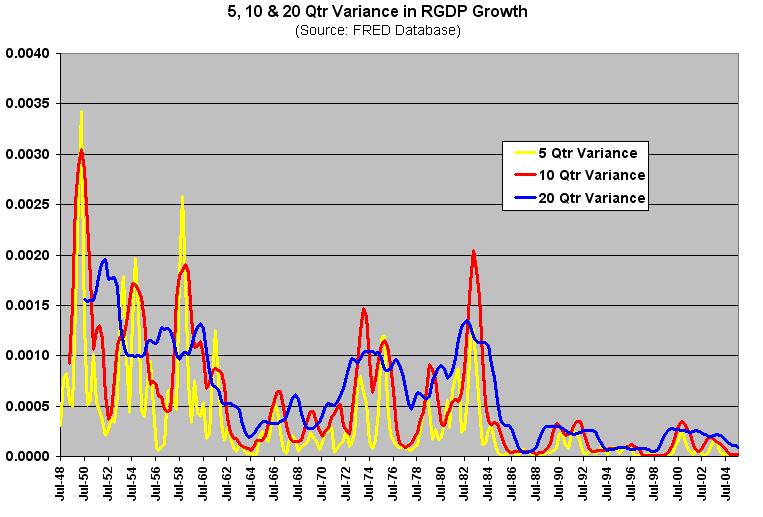 Notice the practical elimination of any volatility in our economic growth. It behooves the question if we're taming economics, learning more and more about what governs and influences the dismal science as time passes. Not mastering it mind you, as that would indicate we'd be able to boost our economic growth rate (which we're not),
 but being able to turn the precipitous drops and rapid recoveries into more of gentle ebbs and flows.
Several ideas come to mind. First and foremost my hero, Alan Greenspan. Notice variance all but ceases to exist once Al came in, implemented wise monetary policy, and destroyed inflation. Stable prices I'm sure contribute greatly to this decrease in volatility.
 However, I also think the Baby Boomers grew the ef up, and instead of protesting every Saturday, got jobs, had kids, which is certainly a life stablizing factor. Globalization has certainly diversified the economy and made us less susceptible to supply shocks. But I certainly would appreciate to hear what others think.
Regardless, the primary benefit to such consistency is that it would eliminate the riskiness of long term investments (which may in part explain why long term interest rates are so low and we're approaching an inverted yield curve).
I'm busy here, so feel free to do the writing for me and tell me what say you.
No comments:
Post a Comment